Debugging Google Analytics While Using Tag Manager
Activate the debug mode of Google Analytics directly via the preview function of Google Tag Manager.
Do you use Google Analytics to analyze your website traffic? And do you use not only the standard integration, but also custom dimensions or events? Then you will check more often whether all data is delivered to Google Analytics as intended.
One way to do this is the debug mode of Google Analytics - and you can activate it with a simple trick automatically in the preview mode of Google Tag Manager.
What is the Google Analytics debug mode?
Besides the Google Tag Assistant, the debug mode in Google Analytics is the best way to quickly and easily fix incorrect implementations. You can activate the debug mode either with the debug version of the analytics.js script or with the corresponding browser extension.
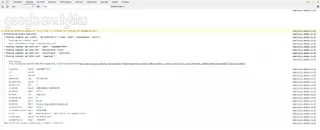
After activation, the debug mode will output all commands in the console of your browser that are executed when called. This includes your advanced settings, PageViews or events.
For each command you see exactly which parameters are set and how.
Activate debug mode in Tag Manager
Even if you use Google Analytics via the Google Tag Manager, you can activate the debug mode. All you have to do is adjust your configuration.
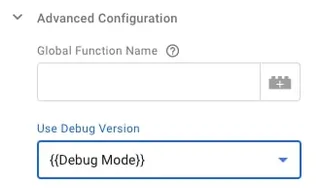
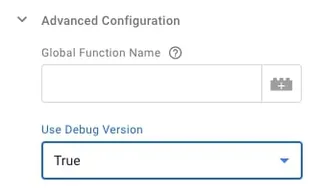
Open the settings in the Google Analytics tag. You will find the entry “Use debugging version” under “Advanced configuration”. Set this entry to “True” and the Tag Manager will load the debugging version.
Why not just leave the debugging mode activated constantly?
Debug mode should only be used for debugging purposes for performance reasons. The debugging version of the analytics script slows down your website.
Automatically activate debug mode in preview mode
In the Tag Manager you have a handy preview mode to check changes before going live. Fortunately, the Tag Manager also provides a variable that checks for an active preview mode.
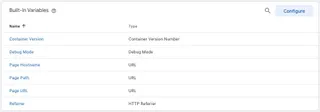
You can find the variable named “Debug Mode” among the built-in variables. If you don’t see the variable, click on “Configure” in the integrated variables and search for it in the list (under “Errors”).
The debug variable has two states. If the preview mode is activated, the variable is “TRUE”, if it is deactivated the variable becomes “FALSE”. So it’s perfect to change a setting depending on the preview mode.
Now switch back to your Google Analytics settings. There you only have to set your new variable for the debug mode - the debug mode will be started automatically as soon as the preview is active!